Weird behaviour of bandwidth charts
Posted: Thu Sep 24, 2020 12:41 pm
There's something strange in BW charts.
I have a WNDR3700 V2, with Gargoyle V1.12.
The option "Save High Resolution 15 Minute Timeframe Data For All Hosts" is enabled.
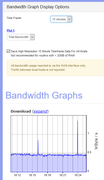
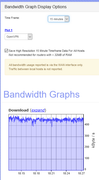
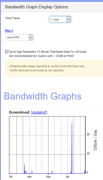
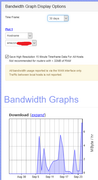
When I select "Total Bandwidth" to be displayed, I have charts in hi-res for all time frames: 15 min, 6 hours, 24 hours, etc.
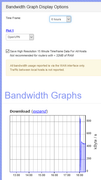
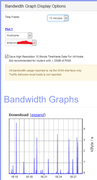
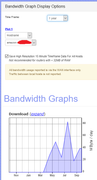
When I select "OpenVPN" to be displayed, I still have charts in hi-res for all time frames: 15 min, 6 hours, 24 hours, etc.
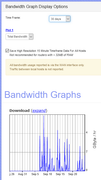
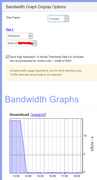
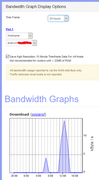
When I select "Hostname" to be displayed, I have charts in hi-res for 15 minutes time frame only.
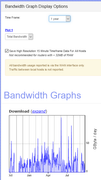
When I select other time frames (6 hours, 24 hours, etc), I have low-res charts, for all hosts.
Any explaination for that?
Screenshots for Total Bandwidth:

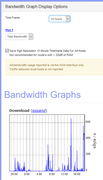
Screenshots for OpenVPN:
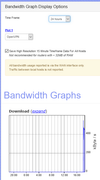
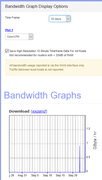
Screenshots for host:
I have a WNDR3700 V2, with Gargoyle V1.12.
The option "Save High Resolution 15 Minute Timeframe Data For All Hosts" is enabled.
When I select "Total Bandwidth" to be displayed, I have charts in hi-res for all time frames: 15 min, 6 hours, 24 hours, etc.
When I select "OpenVPN" to be displayed, I still have charts in hi-res for all time frames: 15 min, 6 hours, 24 hours, etc.
When I select "Hostname" to be displayed, I have charts in hi-res for 15 minutes time frame only.
When I select other time frames (6 hours, 24 hours, etc), I have low-res charts, for all hosts.
Any explaination for that?
Screenshots for Total Bandwidth:
Screenshots for OpenVPN:
Screenshots for host: